Enzyme Simulation

In our Human Body Systems course, students learn about the digestive system and enzymes that help break down various food macromolecules. As a bonus, most of my HBS students are also taking chemistry, so we have opportunity to share ideas across the disciplines.

In the past, we did a hands-on lab measuring the rate of reaction of catalase to break down hydrogen peroxide. We could vary the temperature, pH, agitation, concentration, or a number of other independent variables to determine their effect on the efficacy of the catalase enzyme. While I love doing hands-on labs with students, this one took several days to collect enough data, and the data we collected was often unreliable–students measured reaction rates using gas pressure sensors. Any leaks in the flasks, stoppers, or hoses would give us bad data, and then using the computer interface to find the slope of the pressure increase (our proxy for reaction rate) was a small hurdle as well.

A couple years ago, my class was running behind and I decided to forego the hands-on portion, but I still needed students to learn the effects of various conditions on enzymes. So, I found a great enzyme simulation at Biology Simulations. Very cool! I love how the collisions between molecules are clearly shown and how we can change so many variables to test their effect on the reaction.

However, for my purposes, this simulation incorporated a bit too much. There are multiple enzymes. There are multiple reactants and products. There are inhibitors! SO many things to play around with. Which is all good, but I needed my students to understand the basics. How do things like pH, temperature, and concentration affect an enzyme…

So, I set out to pare the biology simulations version down to just a few variables and a single enzyme.

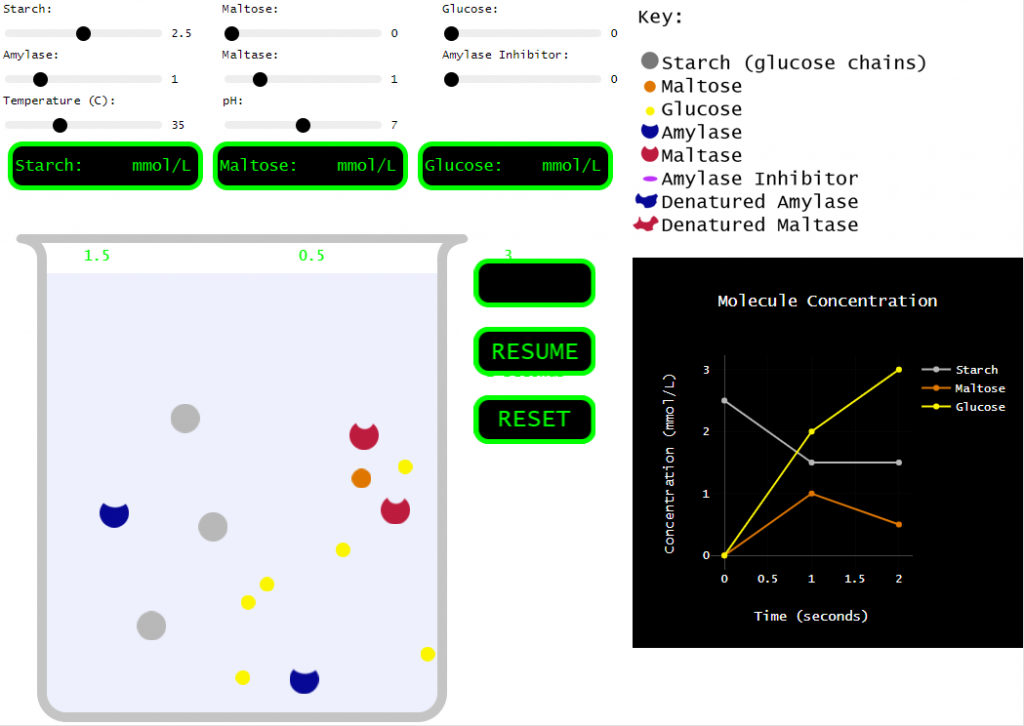
Original (Biology Simulations) version
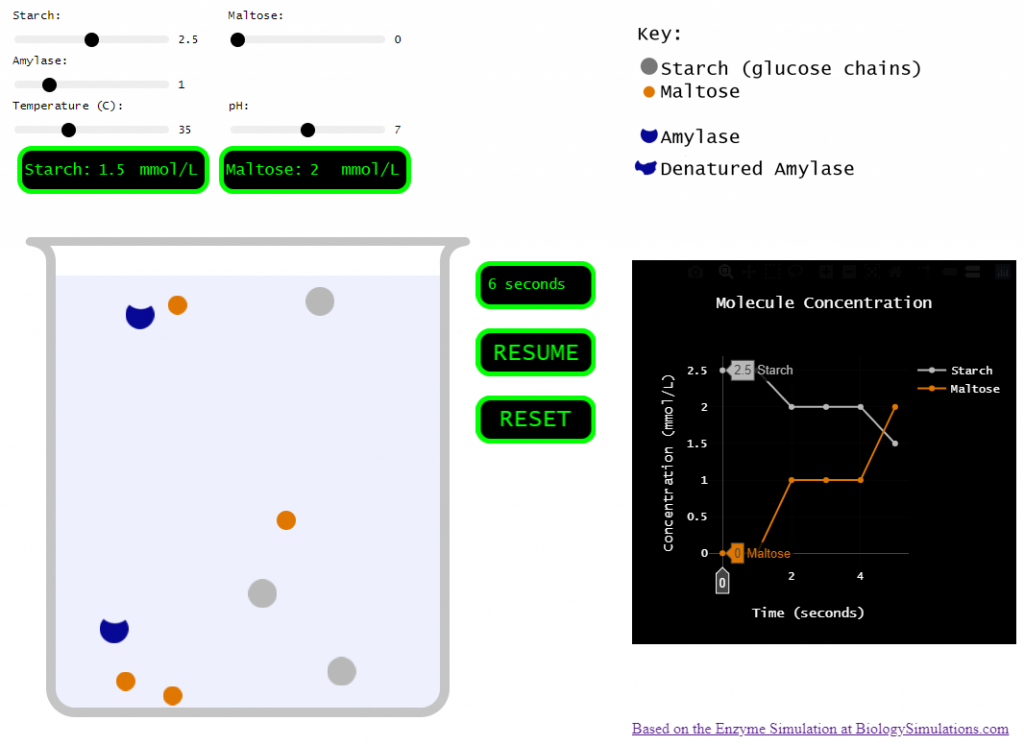
Simplified version

Click the button below to try it out. I also put together a very bare-bones ‘worksheet’ to go along with the simulation. Let me know if this is useful to you.

Interactive Measurement Practice

As we begin the school year in the wake of Covid-19, traditional labs and hands-on activities are very limited. Therefore, we need to find ways to do things virtually. I developed this interactive measurement & scale-reading activity using Construct 3. Students can use this to practice reading the scale on a ruler and reading the volume in three different-sized graduated cylinders.

Length Measurement Features

  • Draggable ruler
  • Checks accuracy of measurement and provides feedback.
    • Accepts measurements within ±0.015 cm of the actual length.
    • Provides encouragement to estimate as accurately as possible for measurements within ±0.03 cm of the actual length.
  • Requires input of units (cm) for each measurement.
  • Challenges users to measure five lengths in a row. Any mistakes will cause the count to start over.
  • Button to download a screenshot when finished.

Source Construct 3 file (open with construct.net)

Volume Measurement Features

  • Practice reading scales on 500-ml, 100-ml, and 10-ml graduated cylinders.
  • Checks accuracy of measurement and provides feedback.
    • Accepts a small range of estimates for the final digit in the reading.
    • Requires recording volumes to the level of precision/resolution of the graduated cylinder.
  • Requires input of units (ml) for each measurement.
  • Requires users to correctly measure 6 volumes to complete the activity (2 for each of the cylinder sizes).
  • Button to download a screenshot when finished.

Source Construct 3 file (open with construct.net)

Density Lab Simulation

Unit 1 of the Modeling Instruction chemistry curriculum has students develop the ideas of mass and volume and then the relationship between them (density). Consistent with the Modeling Instruction method, students collect data and analyze that data to develop a model to describe a relationship.

This year, my school is beginning virtually. It will be a challenge to transform our chemistry lab activities to the online format until we are able to resume in-person classes (and even then, we will be limited in the types of activities that we can do while “socially distant”). As I thought about facilitating my class online, I discovered Construct.net, which is typically used to produce online games. I found that it can be adapted to simulate labs like this one. I created a couple different versions. Check them out!

Dimensional Measurement Version
Water Displacement version

It simply allows students to measure the mass and volume of several samples of a material (currently, it has steel, aluminum, and wood). The first sample is always the same size for everybody, but subsequent samples are random sizes/masses (so encourage students to include a wide range of sample sizes in their data). Students can then use whatever graphing tools desired to analyze the data. A few years ago, I made a simple data analysis tool that would work well for this.

I like that the water displacement version shows which substances sink and float. Also, you can produce some samples that, because of their size or density (wood) do not completely submerge. This provides a chance to discuss what the water displacement measurement represents.

The water displacement version can also be used to show the relationship between cm3 and ml. Just measure a sample with the ruler and then dunk it in the water.

Leave a comment about any issues you find or requests for features. Here are some things I’m thinking about:

  • More realistic interactions: an on-screen ruler to measure length, width, and height would build measurement skills. But, Contruct.net is really a 2-dimensional tool, so measuring that third dimension would be a challenge.
  • I had a request for cylindrical samples to better match the materials many of us use for the actual lab activity. It’s an idea for the future, especially if this is used to supplement the in-person activity for those who are absent.
  • UPDATE July 27, 2020:
    • Added zinc, copper, and lead to the substances.
    • Changed the button text to say “New Size”
    • Clarified the instructions.

The source files are available for anyone wanting to modify or extend. This was my first time using Construct.net, so keep that in mind before you berate me for my shoddy work 🙂. I do encourage anyone else working on this or similar lab simulations to share what you come up with.

Construct.net Source File – Version 1 (LxWxH Volume measurement)

Construct.net Source File – Version 2 (Water Displacement Volume measurement)

Wall-Size Periodic Table

I’ve produced a printable periodic table for posting on the wall in my classroom (updated April 2017). I thought other teachers might wish to do the same, so I’m making it available here.

This version is designed to be printed in color on 4×6 photo paper (I chose matte finish for less glare, but glossy might work too).  I had mine printed at Amazon Prints for about $11.00, though many local or chain shops may have special deals that would allow you to get this printed pretty cheaply. Each individual element block is then taped together on the back or glued onto a backing material. The final dimensions are about 6 feet wide and 3-4 feet tall.

The periodic table features include:

  • Element name, symbol, atomic number, and atomic mass
    • Includes updated names and symbols adopted by IUPAC through 2016
  • Common ions for most elements
  • Color-coded background for element families/groups
  • Symbols in black (solid), blue (liquid), or red (gas) elements (at room temp.) Synthetic elements are in gray.
  • Group numbers above each column (1 – 18)

To print your own, here is a zip file of jpeg photos that you can upload or bring to your photo printer:

Periodic Table Images ZIP file

The source files used to produce the images are provided here should you want to make any adjustments.  The element database is an excel file, which is used in combination with word’s mail merge capabilities.

PT-4×6-Color-Merged

PT-4×6-Color-Template

PT-Element_Data_Base

Note: images were produced by first saving the merged word document as a PDF and then using ImageMagick command:

magick.exe -density 300 PT-4x6-Color-Merged.pdf[0-117] 
-background white -alpha remove -resize 770x996 -gravity
center -extent 800x1200 element.jpg

Version 1.0

My previous classroom had a very large blank wall to accommodate a very large periodic table.  This is how it looked in my classroom.

The data is mostly based on the information in the element data base downloaded from Central High School’s website in St. Paul, MN, with a few corrections and additions from Wikipedia.org and WebElements.com.

The Periodic Table

Here are the printable versions:

Periodic Table – Merged (MS Word .doc)

Periodic Table – Merged (PDF)

UPDATE:  I’ve since created a version with two elements to a page so it’s not quite as huge.

Merged-half-page (MS Word .docx)

Source Files

These files were used to produce the periodic table using MS Word’s mail merge capabilities. Should you like to change it to your liking, you can download these files and produce your own.

PT Element Data Base (MS Excel .xls)

PT Mail Merge Template (MS Word .doc)

PT Mail Merge Template – half page (MS Word .doc)

Empirical Formula Lab: Zinc Chloride

Procedures

1. Find the mass of a clean, dry, labeled beaker. (49.45 g)

2. Add zinc to the beaker and find its mass. (52.72 g)

3. Add 50 ml of HCl to the beaker. Record observations.

4. Place the beaker on a hot plate to evaporate the water.

Day 2:

5. Find the mass of the zinc chloride left in the beaker.  Make sure all water has been driven off.

Final Mass of Beaker with Zinc Chloride:  56.27 g

Now, you have enough information to determine the empirical formula of Zinc Chloride.

Close