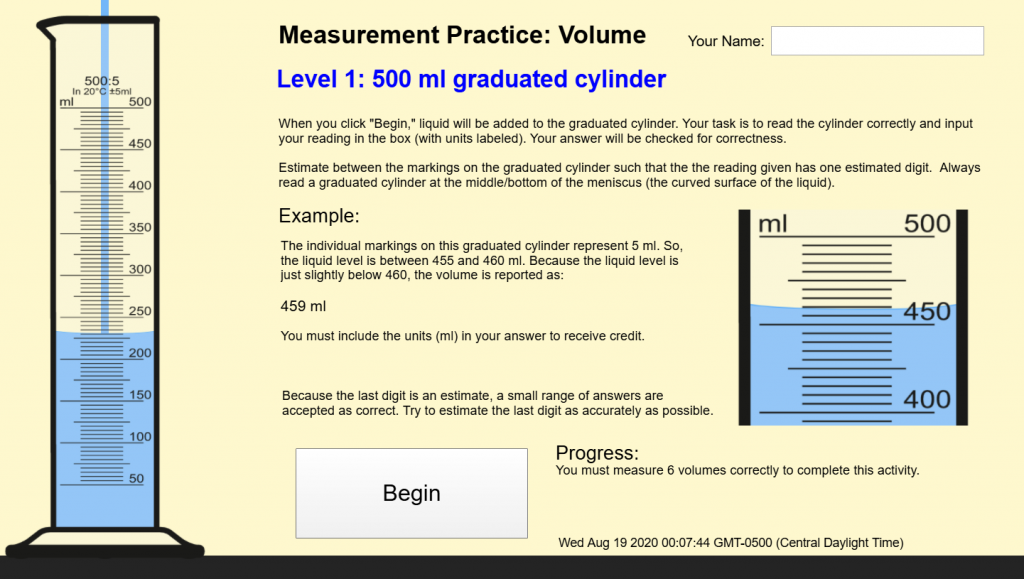
As we begin the school year in the wake of Covid-19, traditional labs and hands-on activities are very limited. Therefore, we need to find ways to do things virtually. I developed this interactive measurement & scale-reading activity using Construct 3. Students can use this to practice reading the scale on a ruler and reading the volume in three different-sized graduated cylinders.
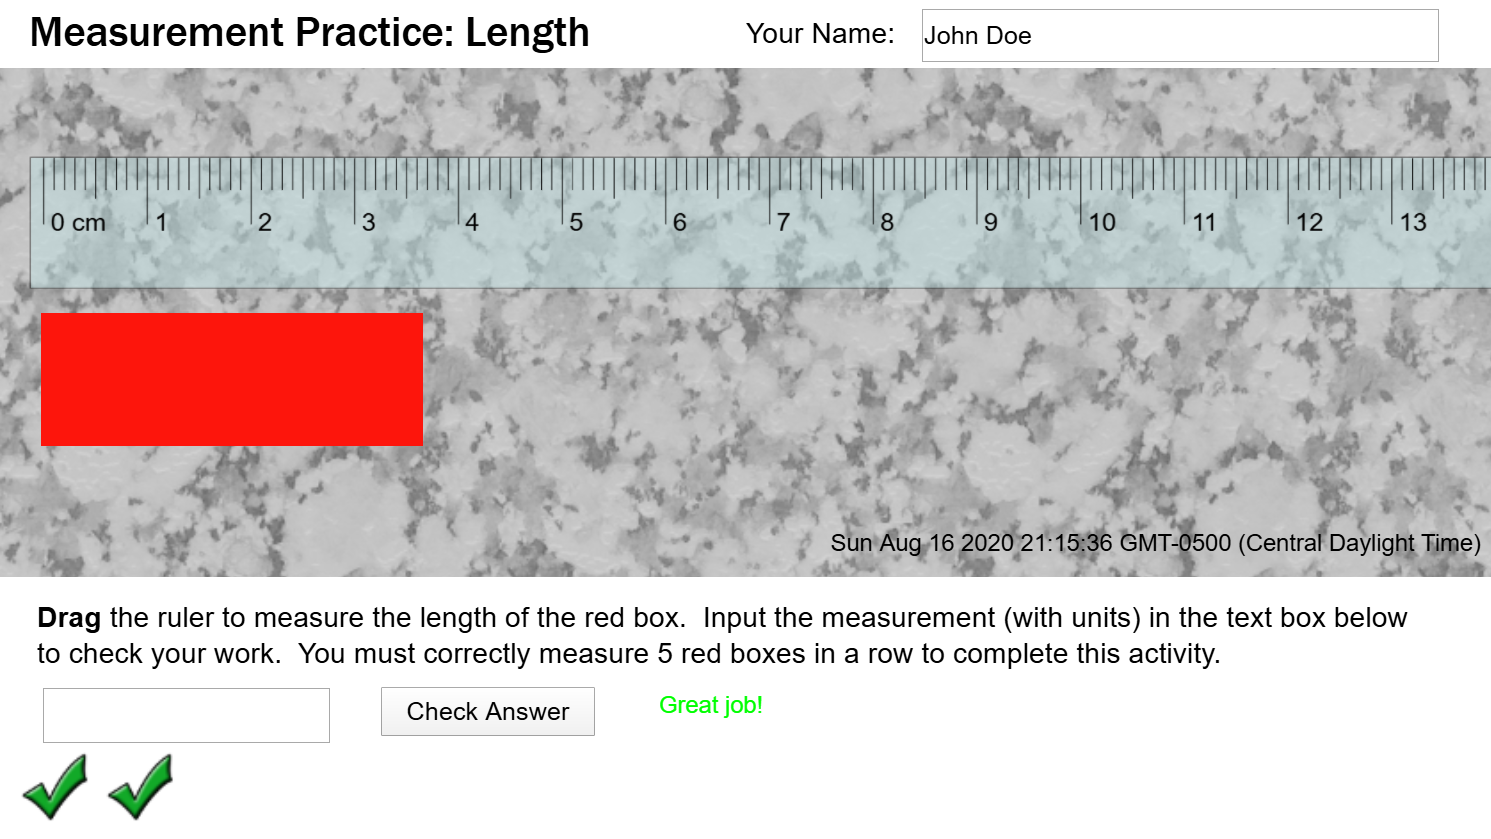
Length Measurement Features
Draggable ruler
Checks accuracy of measurement and provides feedback.
Accepts measurements within ±0.015 cm of the actual length.
Provides encouragement to estimate as accurately as possible for measurements within ±0.03 cm of the actual length.
Requires input of units (cm) for each measurement.
Challenges users to measure five lengths in a row. Any mistakes will cause the count to start over.
In AP Physics 1, students need to learn about the relationship between wave frequency and wavelength (wave speed). If students are going to investigate this relationship and collect data for analysis themselves, there are a couple options:
Snaky springs – ($13.50/ea from Amazon and comes with slinky and rope, $17/ea from Arbor Sci, $18/ea from PASCO) – Students can set up standing waves in the spring, then measure frequency and wavelength. It’s very tactile and when it works, it works well — data is reliable. It is difficult to get a feel for how to oscillate at the correct frequency for the standing waves (and some groups weren’t really successful doing so in the time we had). Only allows for 4 or 5 harmonics before it becomes very difficult to introduce such high-frequency oscillations.
Computer Simulation – PhET – Allows adjustment of amplitude, frequency, end type, damping, etc. and measurement of wavelength. A fine option, though not as tactile. I use it for students to investigate wave reflections, but have not used it for wavelenth & frequency. I would prefer a real-world, more tactile method if possible — I question whether students always make the connection to real-world situations when their primary experience is a computer simulation.
Wave drivers – (Vernier: $115, but also need a power amplifier, $199; PASCO: $249, but also need a function generator, $259+; CPO $400, there are probably other systems available, but they all seem to be very expensive) – allows students to adjust the frequency of vibrations in a string until a standing wave is set up, then measure wavelength. Using this method, students are very interested and engaged, and they get to see a real-world physics phenomenon. The data produced is very reliable. But this would be a very expensive set-up to provide for 6 lab groups.
I set out to see if I could make my own wave driver for less $$$.
Speaker Version
For my first iteration, I used some Logitech computer speakers ($20 on Amazon). Essentially, I removed the grille covering the speaker and hot-glued a bent paper clip to the speaker cone, that allows the speaker to drive a string.
I tie the string to a solid object on one end (ring stand) and run it across a table and off the end over a pulley. Then, hang a weight off the pulley end of the string to introduce a known tension.
Diagram of the speaker version of the apparatus
I connect the speaker system to a laptop, have students go to an online function generator (like this one, though there are many available), and adjust the frequency until a standing wave is set up. Then they measure the wavelength and record the frequency/wavelength pair.
By graphing wavelength vs. frequency, students can determine that an inverse relationship exists, which they can then linearize (possibly by using my data analysis tool). The slope then comes out to be a speed, which we determine to be the wave speed in the string.
The speaker works wonderfully. The wave amplitude isn’t great, but the standing waves are clearly visible.
I also tried this with a cheaper speaker system, but the speaker cone barely moved, so it didn’t produce visible standing waves in the string. You need a speaker for which the cone moves with a decent amplitude to drive the waves in the string.
Homemade Wave Driver
I wanted to see if I could further cut down on the cost. I obtained the following supplies:
Description
Source
Cost/each
TDA7297 Audio Power Amplifier *(There are many similar versions available. Try to find one with a 5.5 mm OD barrel/coaxial power plug and a 3.5mm aux audio connector. The one I bought had a 3-pin audio connector, so I had to buy some of those and solder it to a 3.5mm aux cord. You only need a single channel or just use 1 of a 2-channel amplifier)
DC 12V AC Adapter *(You may be able to find them more cheaply – just need a 5.5 mm OD / 2.1 mm ID plug. I went with a 2-amp output to ensure enough power, but probably 1A is enough.)
2″ or 3″ speaker A Logitech 3W 4-ohm speaker worked ok. A 50W car speaker worked ok also, but I’ll probably need to use a heavier string. Around a 10W speaker seems to be ideal.
Screws – I have an assortment, but here’s what I used (3) tiny screws to attach PCB amplifier board to wood board (2) 2″ drywall screws (or similar) to attach speaker to board (?) I also screwed down the audio cable with a piece of plastic to keep it from being accidentally pulled off and damaging stuff.
1×4 mounting board (about 6″ long) – From scraps
Total
$12.50 – $15.50
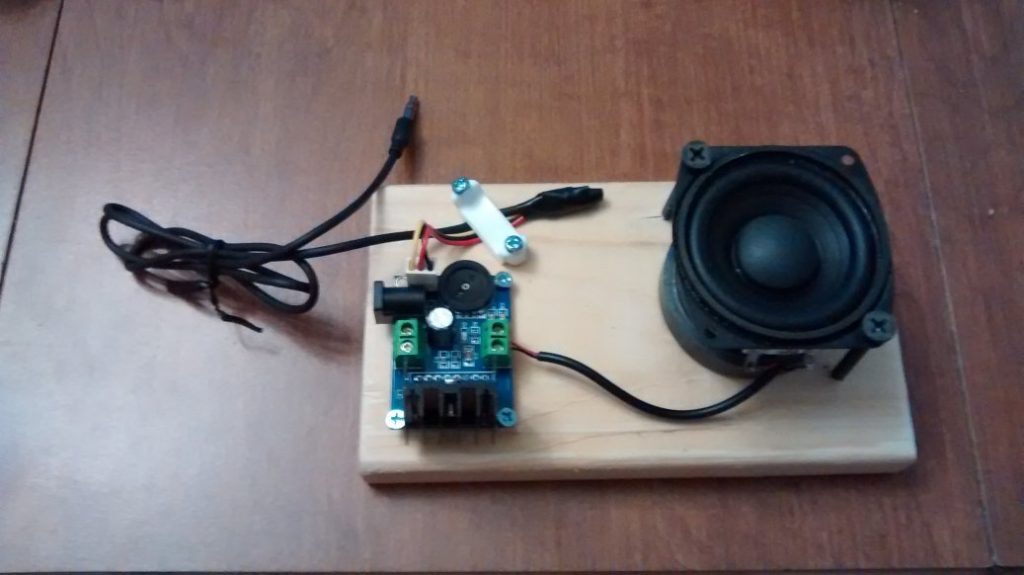
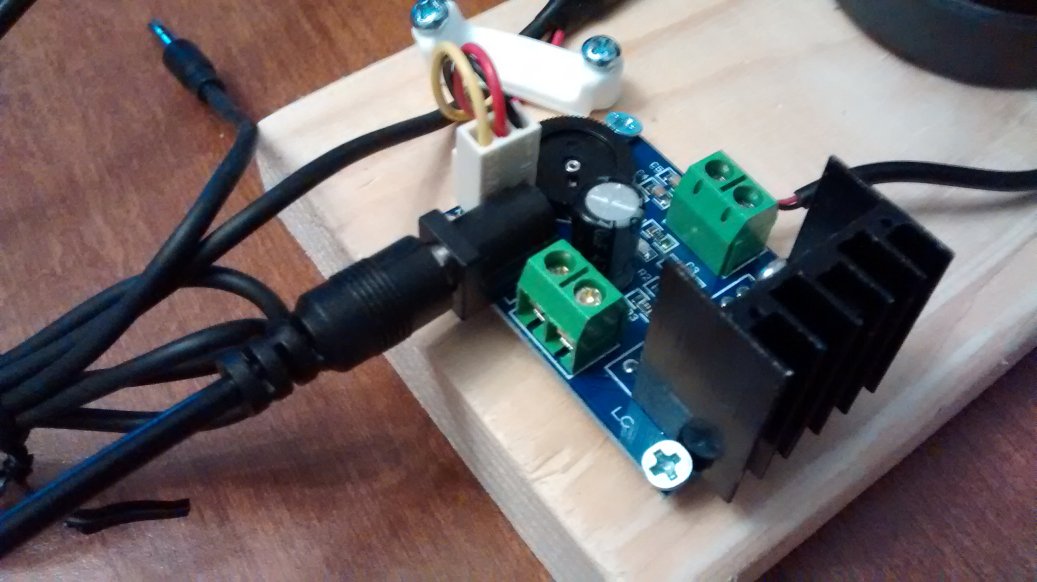
The initial prototype works great.
Prototype. Just needs power to the barrel connector on the PCB and a bent paperclip glued to the speaker cone to interface with the string to produce standing waves.
Assembly:
Cut a piece of 1×4 board in about 6 inch long pieces to serve as a base.
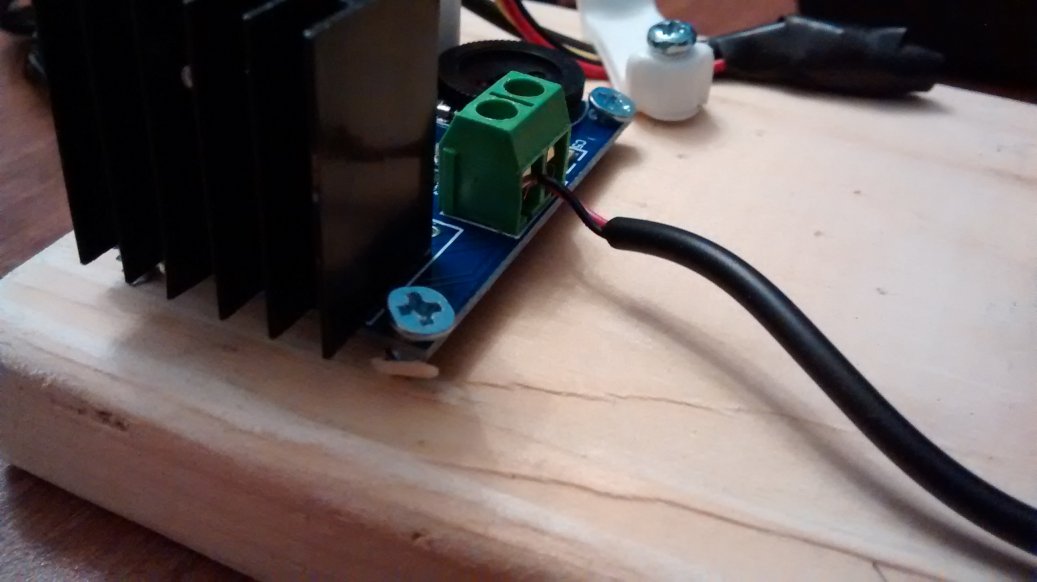
Use 3 tiny screws to secure the amplifier PCB to the 1×4. Arrange it so the power connector hangs off one side of the board.
Cut a 3.5mm aux cord in half. Strip the insulation from the end you cut. There are 2 wires inside that carry the left and right channel signal (carefully strip about 1/4″ of insulation from these as well), and bare wires which are neutral. Of course, not all cables are made the same way, so yours may be different.
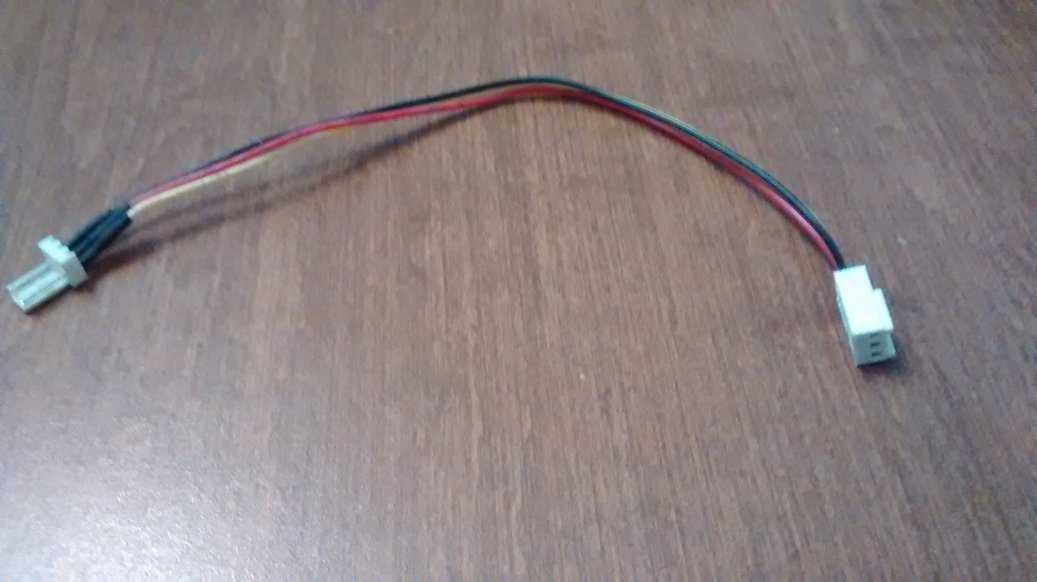
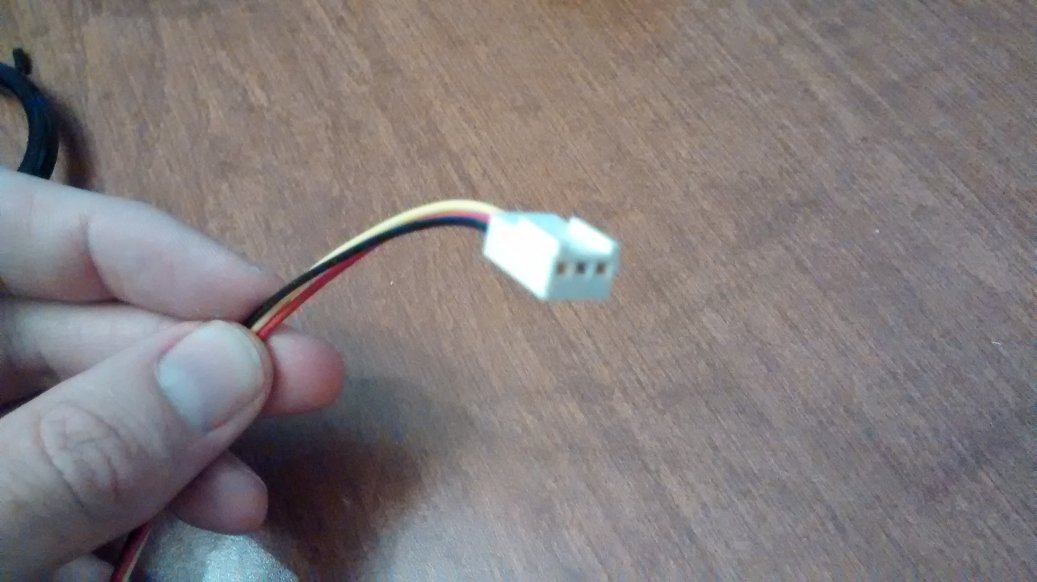
Cut a fan extension cable in half so you have the female pin end (shown). Strip the ends you cut.
Twist together the black fan connector wire with the neutral aux cord wire. Similarly, connect the red fan connector wire with one channel from the aux cord. And the yellow fan connector wire with the other channel from the aux cord. Solder these connections, then cover each one with heat-shrink tubing (or easier: electrical tape). Sorry, I forgot to take a picture of this…
Plug the female pin connector into the amplifier board. I also used an electrical cord staple, removed the nails, and screwed it down on top of the aux cord wires to hopefully prevent some jerk from jerking the cord and destroying my wave driver.
Run a wire from the amplifier output (+) to one terminal on the speaker.
Run another wire from the amplifier output (-) to the other terminal of the speaker. (Doesn’t matter which is which)
Tighten the screw-connectors on the amplifier output terminals.
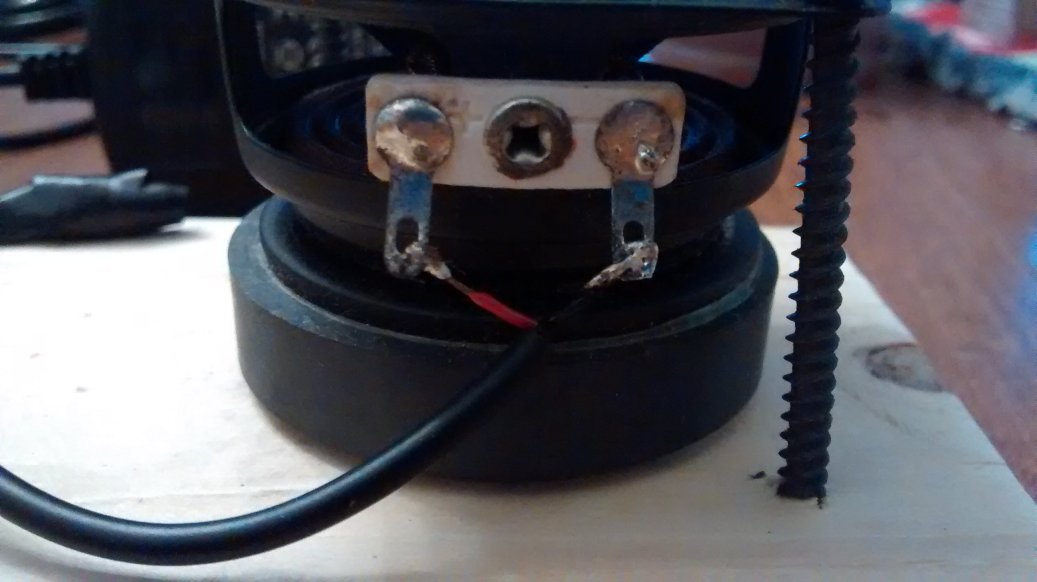
Solder these other ends on the wires to the speaker.
Use the 2″ screws to attach the speaker to the 1×4. Depending on the size of your speakers, you may need longer/shorter screws.
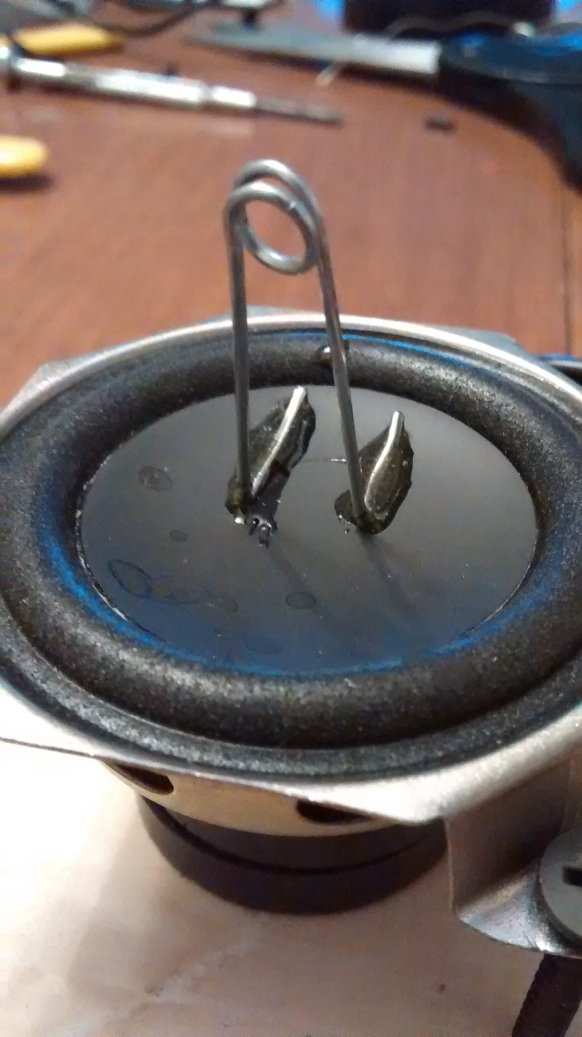
Bend a paper clip and hot glue or epoxy it to the speaker cone as shown: The cord or string being driven sits in the loop on the paper clip.
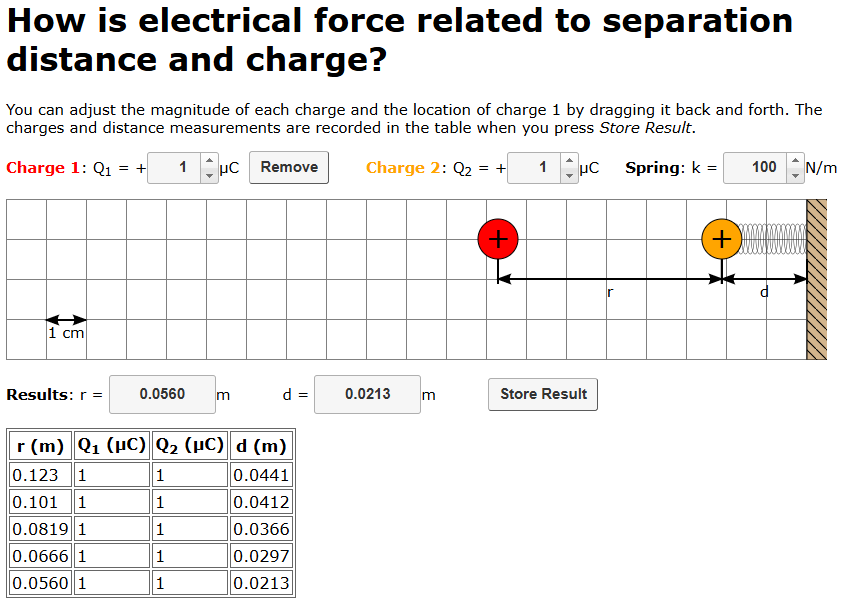
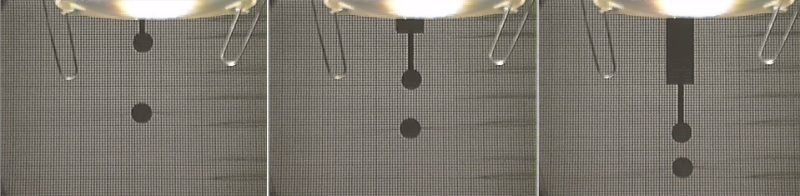
In the Modeling Instruction materials for Physics: E&M, there are videos provided that can be analyzed to develop quantitative relationships between electrostatic force, separation distance, and charge quantity. However, this process is rather complex and requires using distance as a proxy for force. While the inverse-square relationship comes out (though even that can be difficult to determine if students aren’t very careful about the video analysis), it does not allow for a determination of the Coulomb constant, since the charge of the objects in the video is not known.
Using actual charged pith balls and measuring repulsion.
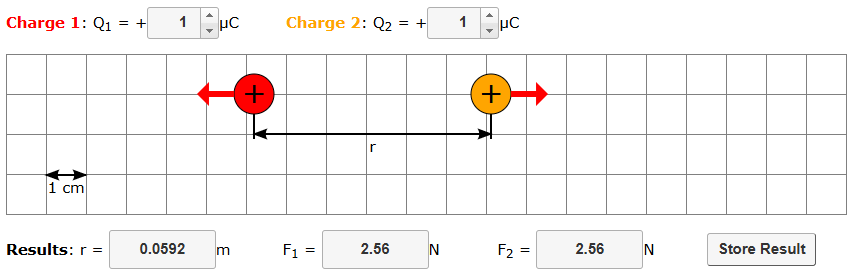
To try to remove some of the difficulties while still using the data analysis to develop model for electrostatic force interactions, I developed a simulation that allows a more direct “measurement” of charge, distance, and force.
As part of my action research project for my Master of Natural Science degree from Arizona State University (home of Modeling Instruction), my research partner Mr. Wirth and I looked at how we could apply computational modeling at several key points in the curriculum to improve students’ understanding of physics.
We worked with a small sample group, but we had some promising results. Spreadsheets allowed students to solve more complex problems than can typically be solved in a first-year physics course. Spreadsheets freed students a bit to think about the problem rather than focusing on the computation, though learning to graph and write equations in excel was challenging.
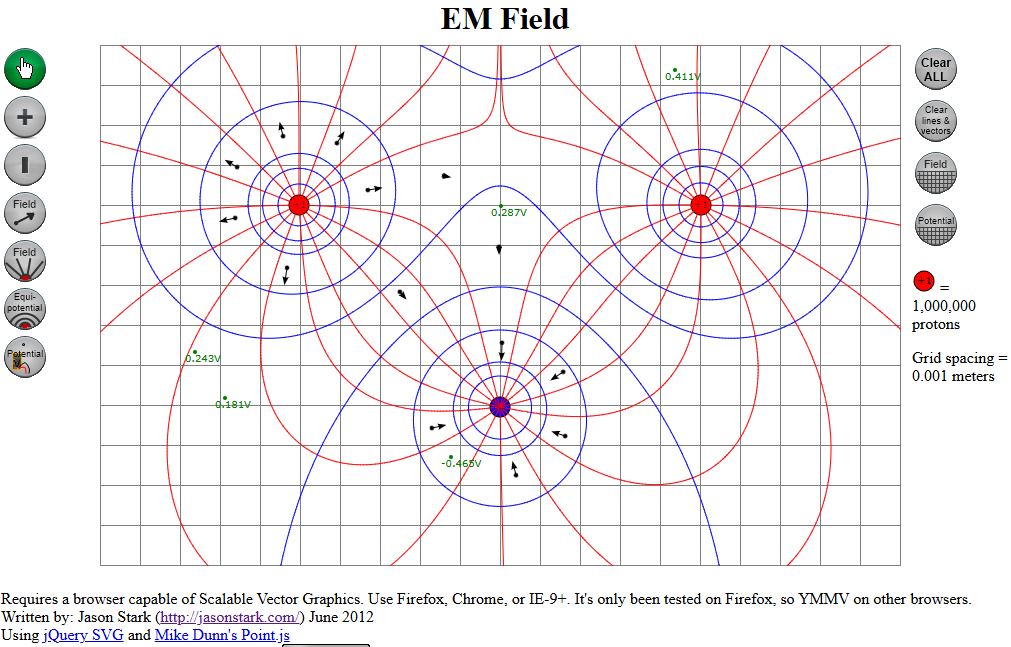
This summer, I’m at Arizona State University taking a modeling instruction workshop in physics – electricity and magnetism. In dealing with electric fields (vectors and lines), potential, and equipotential lines, the curriculum materials rely on EM Field software that hasn’t been updated in many years and is no longer available for purchase or download. The program is a 16-bit windows-95 era program and won’t even run anymore on Windows 7.
So, I set out to try to build a similar simulation with the same functionality online to make it available to other teachers.
Check it out and leave me your feedback about what works, what doesn’t work, and any suggestions for improvement.
The following student-exploration worksheet is based on Unit 1 – Worksheet 3a from the Modeling E&M materials, but I thought I would provide it here in case teachers wanted to use it. The directions are not very refined, but it is a start.


